Understanding Bridge Statistics - Skewed Distributions
There appears to be a lot of confusion over the correct statistical approach to use with DECWER, DDOLAR and DEFWER. Most of this confusions seems to be caused by alleged professional statisticians, who really should know better, who believe Bridge is equivalent to rolling a dice. It isn't.
DECWER, DDOLAR and DEFWER are skewed distributions, they are not normally distributed. They are a performance metric, they are not a coin flip or a roll of the dice. Occasionally it might be appropriate to use a binomial distribution as an approximation, but this should be used with care and in the appropriate circumstances.
Let me illustrate with some real world examples.
My data set is ACBL BBO events from 2020 and some of 2021. I have over 15,000,000 individual boards.
DECWER is the declarer weighted error rate. It measures declarer ability. If I take all pairs with 5,000+ total boards played in ACBL BBO events, I have 246 pairs and 492 players (not necessarily unique). Each player declares approximately 25% of all boards so the minimum number of boards declared is approximately 1,250. I generally use a threshold of total number of boards played, not number declared, so I always include both players in a partnership.
I chart their DECWER and number of boards declared and end up with this:
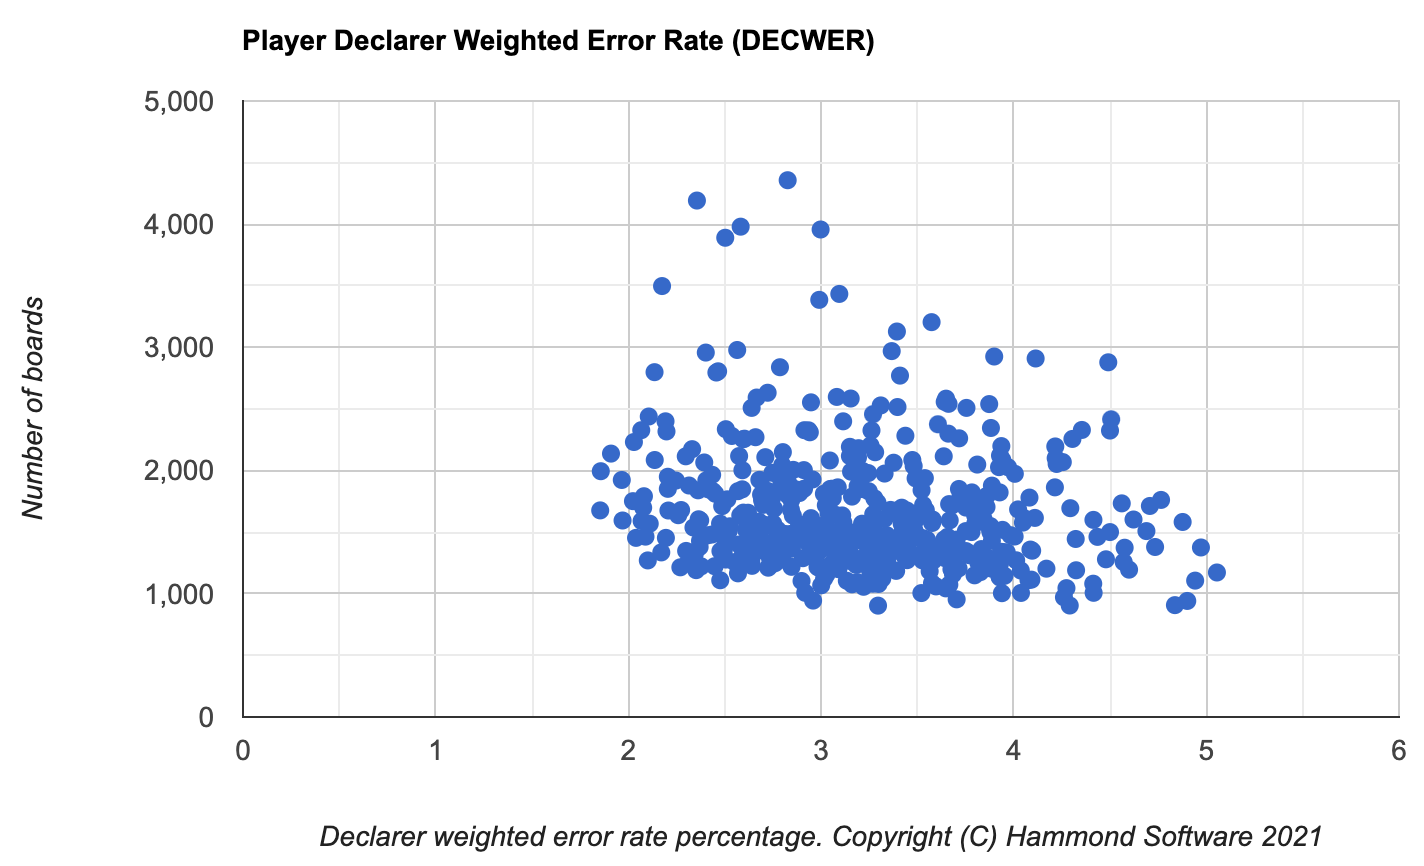
The error rate is on the horizontal X axis. The better you are, the fewer errors you make, the closer you are to the left of the graph. The number of boards declared is on the vertical Y axis. The more you play, the higher your dot.
The best player has a DECWER of 1.85%. There are five (5) players with a DECWER under 2.0%.
What is the mean error rate for this distubtion? See if you can estimate before reading any further.
The unweighted mean value is 3.219. The median (the value for the 246th player on a ranked list) is 3.192%, the 247th player is 3.193%.
The unweighted mean treats each player as identical. For example, imagine the above graph, but where every player has declared exactly 1,250 boards. All the dots would be on a horizontal line. Every player is treated the same and the mean can be found by adding all the player error rates and dividing by the number of players. The weighted mean, which factors in the number of boards played by each person, is 3.186%. For the weighted mean, you count all boards played and calculate the error rate.
Look at the chart above and decide if you think this has a "normal" distribution.
The standard deviation for the population using the unweighted mean is 0.635.
If we were to apply the normal distribution methods taught in your High School class, or even in your College mathematic course, then you may remember the empirical rule which states that approximately 68.27%, 95.45% and 99.73% are within one, two and three standard deviations of the mean. Let's see how this applies to the real world data.
The mean is 3.219. The standard deviation is 0.635. The population is 492. Normal distribution states that 22 players will have a standard deviation of more than 2. There are predicted to be 11 players on each side of the graph.
The third best player has a DECWER of 1.910%. This is 2.06 standard deviations from the mean. The fourth best player has a DECWER of 1.966%. This is 1.97 standard deviations from the mean. Only three players have a standard deviation of over 2 on the left side of the graph.
However, there are 19 weaker players with a standard deviation of more than 2 on the right side of the graph.
The statisticians will gleefully point out that exactly 22 players have a standard deviation of more than 2 and this proves that statistics works! But when it comes to detecting cheating in Bridge, the alleged statisticians are wrong. Only three players are on one side of the curve, 19 on the other.
Some reasonableness now needs to apply. Clearly DECWER is a performance metric. If we are interested in cheating, why are we including weak players in our sample? Surely we should just look at the top players, particularly if we are interested in detecting cheating in the top players.
I then take the top 100 players, run the same numbers. The mean is 2.378, the median 2.434, the standard deviation is 0.207. The same three top players are over two standard deviations from the mean, but the worst player with a DECWER of 2.660% is 1.36 standard deviations away from the mean. We have flipped the skewness. There was a big drop in the mean and also a drop in the standard deviation. All of this should be somewhat obvious if we are taking smaller samples, particularly samples on one side of the graph.
Hopefully you now understand a little about the skewness of Bridge data. It seems axiomatic: Bridge statistics is a performance metric. As you get better, your statistics will improve. You count better, your concentration is better. However there is a limit to how good your statistics can be because of the randomness of Bridge.
The following is the same graph, but for all players in partnerships with 500+ total boards.
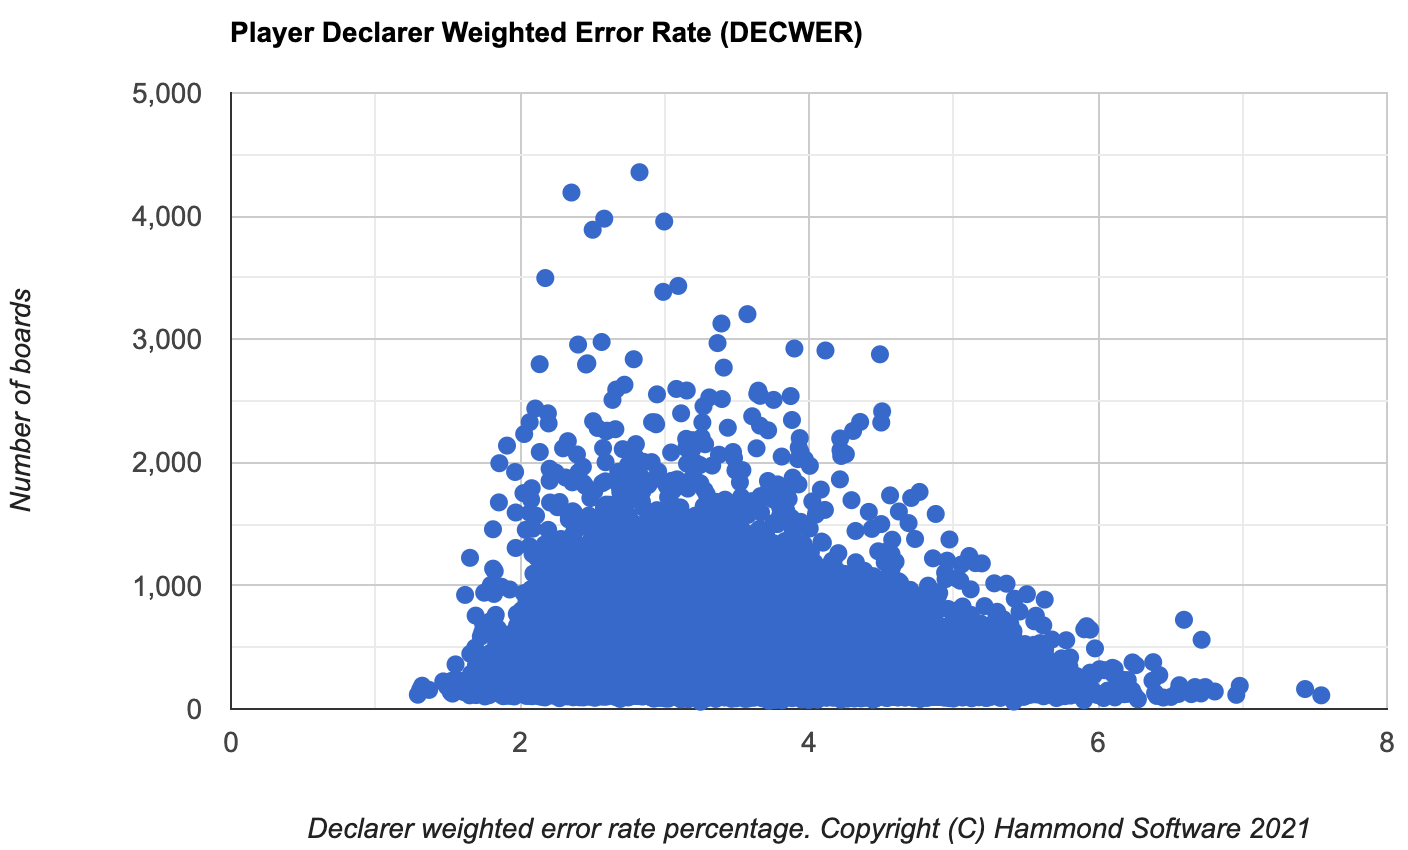
The skewness is more apparent. There are 30,312 players covering 9,765,232 boards. The mean is 3.431, the median is 3.391, the standard deviation (SD) is 0.745. There are 254 players to the left of the graph that are over 2 SD from the mean, there are 0 players that are over 3 SD. There are 1,087 players to the right of the graph that are over 2 SD from the mean.
This is the same chart, but with only the data from the top 1,000 players.
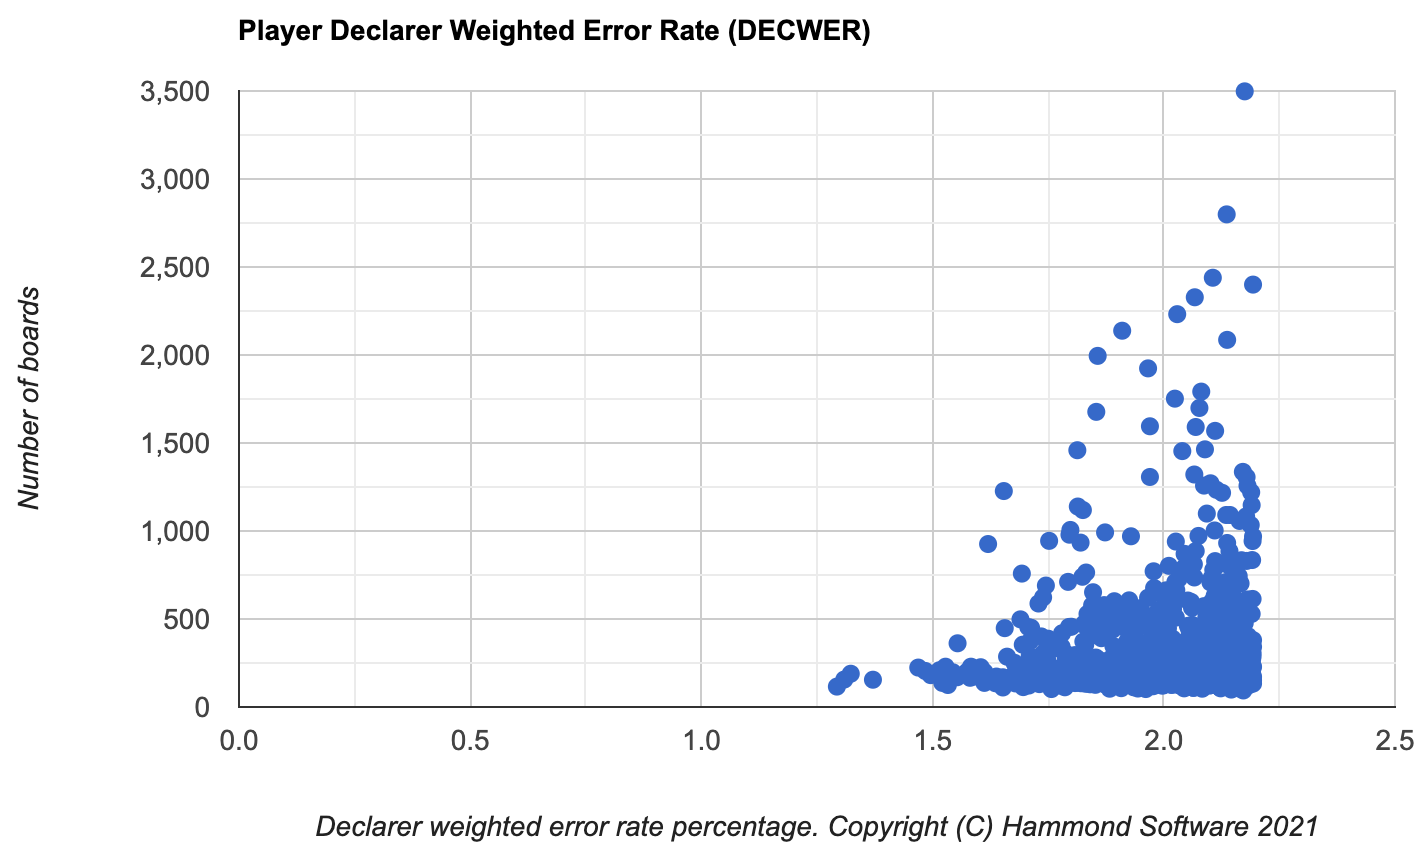
The best four players are over 4 SDs from the mean. The skewness in the chart is apparent.
Opening Leads
It is the opening leads and the DDOLAR and ADDOLAR calculations that appear to confuse everyone the most. Let me start with the player DDOLAR for pairs with 5000+ total boards played.
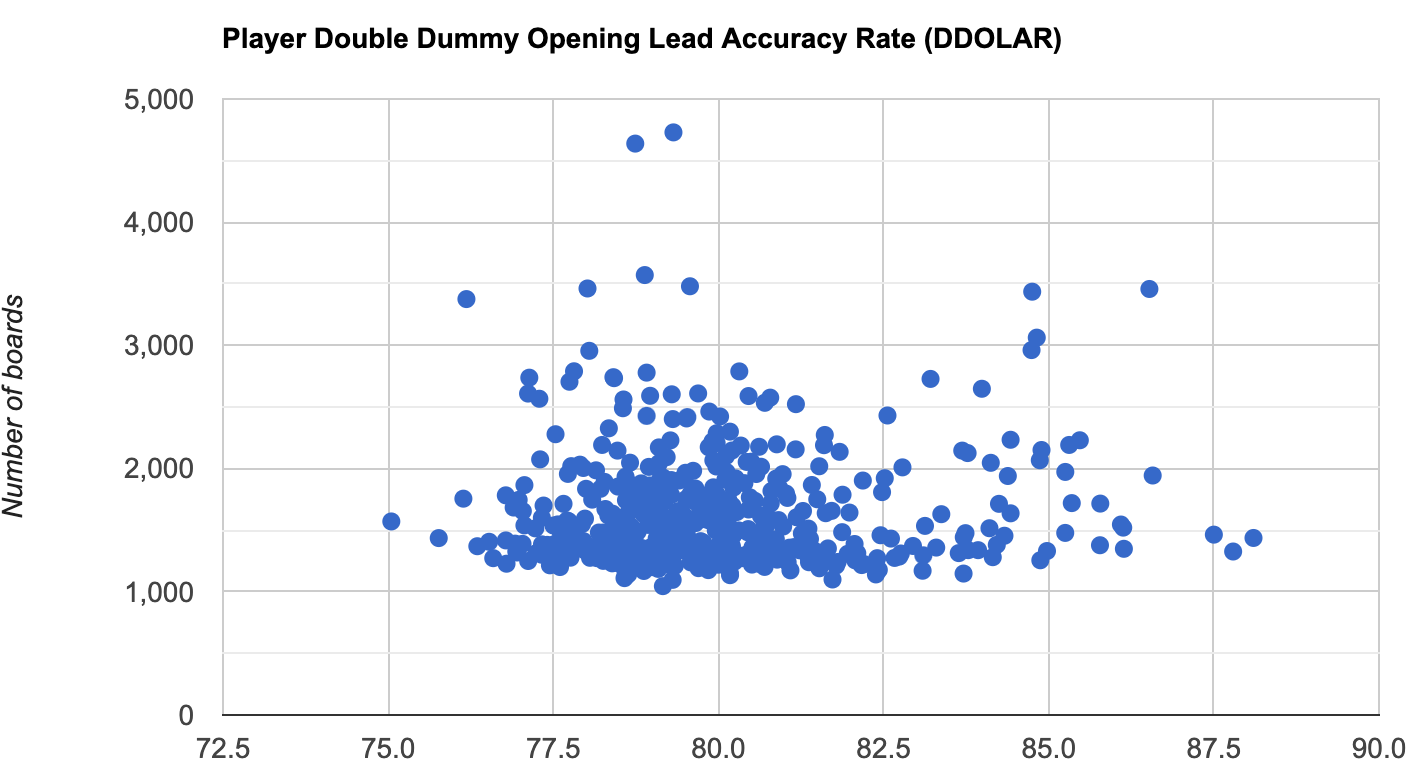
I currently show opening leads as an accuracy rate, not an error rate. Therefore the further to the right, the better you are on opening lead.
These are the same 492 players, the mean is 79.932, the SD is 2.07. Five players on the right of the chart are over 3 SD, an additional 26 on the right of the chart are over 2 SD. A total of 31 players on the right of the chart are over 2 SD. There are two players to the left of the chart that are over 2 SD from the mean. The data above (and below) almost certainly includes data of players that are cheating.
The following is the same players, but it shows the partnership data not individual data.
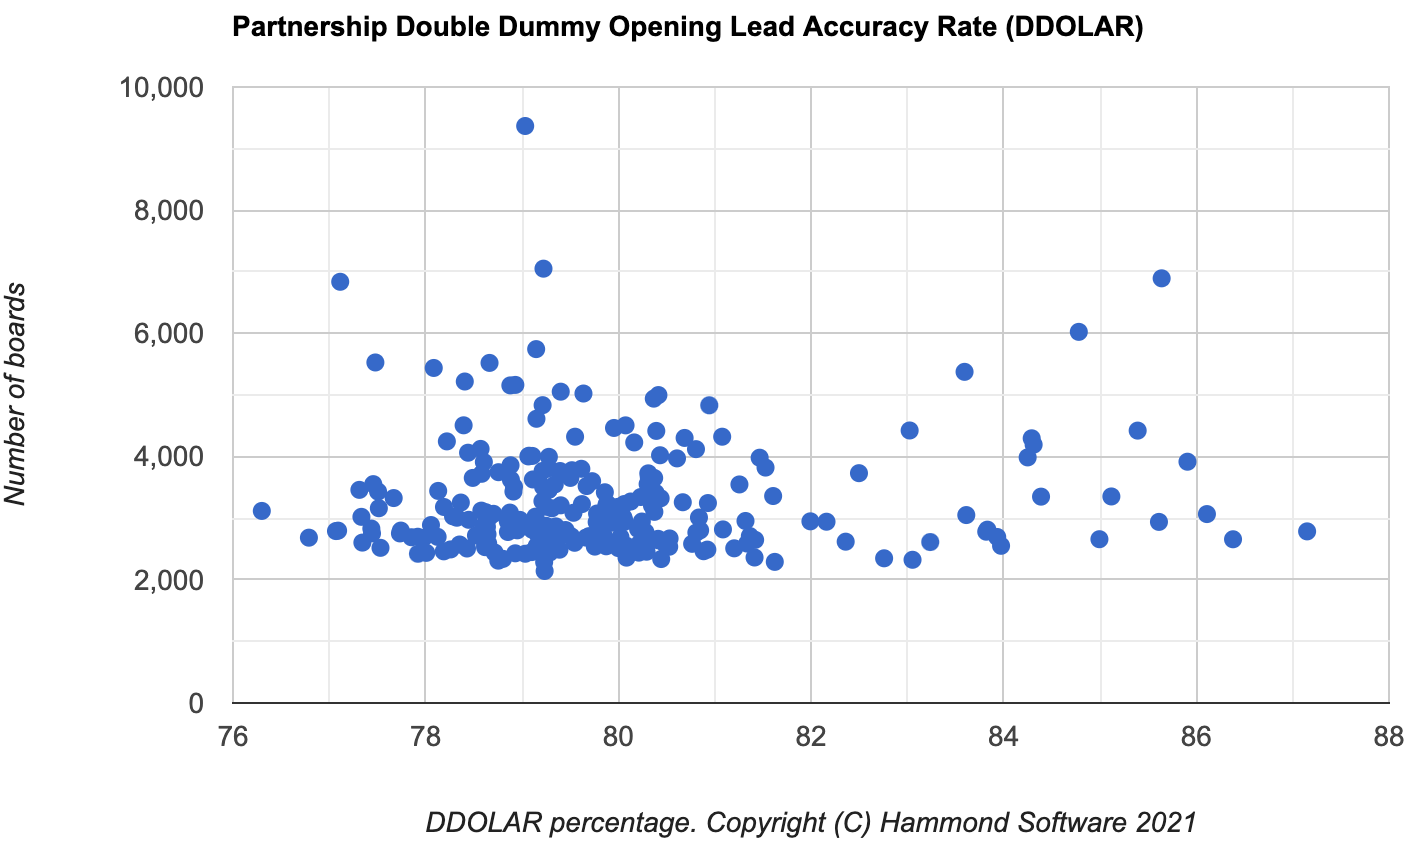
This is a classic two humped cheating chart. On the left, you can see a bell curve with a mean of approximately 79.0. On the right, you see a second bell curve with a mean of approximately 85. The classic two humps come from experiments where students were cheating. Now, I am not saying that all the players on the right are cheating, just that they are suspicious and should be investigated.
In discussions on Bridge sites, I have seen lots of people, including alleged professional statisticians, say you can use binomial calculations.
Let's first look at opening leads and the data behind the data.
For every 100 boards, there are approximately 25 boards, that do not matter from a double dummy perspective.
For another 41 boards, you could pick a card at random and be successful. See my seminal article monkeys with typewriters where a blind monkey has a DDOLAR of 65.88%.
We are left with 34 leads. The monkeys with typewriters article shows that a trained monkey would have a DDOLAR of 77%. In other words, at least 11 of the remaining leads would be considered a normal Bridge lead.
We are left with approximately 23 leads out of 100. An average club player will get 2 of these correct, an average ACBL tournament player will get 3 of these correct, a world class player will get 4 of these correct.
It can be a little hard to understand the above. Often these problems are best understood by an analogy.
You are going to take a quiz. There are 100 questions. All multiple-choice. The answer is a number between 1-13. The questions will be in random order.
25 of the questions will be "write down a number between 1 and 13". Whatever you write, the answer will be correct.
41 of the questions will also be "write down a number between 1 and 13, but the answer is not 'n'" where n is a number between 1 and 13.
11 of the questions will be relatively easy, "what is 4+2?"
The other 23 questions will be progressively harder,
with some/most of them being a simple guess. Example questions:
The answer is either odd or even. Pick your number.
The answer is one of three possible choices. Pick your number.
The answer is one of four possible choices. Pick your number.
The answer is one of six possible choices. Pick your number.
The answer is unknown. Pick your number.
Your counter-argument will be that Bridge leads are not like that. You know from the bidding etc. etc. My answer is that you have not studied, and do not understand, the data. Approximately 50% of the time you are on lead, your side will not have bid. Yes, your partner _may_ have had the chance to make a lead directing call, and did not. Yes, you know the cards in your hand. Even when the world's top Bridge players are confronted with this problem, the average DDOLAR is 81%. Lesser players have an average DDOLAR less than this.
Professor Marvel, the aforementioned professional statistician, will try and convince you that the DDOLAR is an binomial distribution around 0.81. However, a little logic and thought behind the data, will show that it is far easier to have a DDOLAR below 81% than a DDOLAR above 81%. The problems you face with the 19% you get wrong are far harder than the simpler choices you have with the 81% that you get right.
Should we use DDOLAR or ADDOLAR? DDOLAR is the double dummy opening lead accuracy rate. ADDOLAR is the same but it removes all leads which are double dummy (DD) irrelevant. From the data, we know that approximately 25% of all leads are DD irrelevant. How does this impact individual players?
If I look at players with 5000+ total boards, they are on lead for a minimum of approximately 1,250 leads. These players ranged from 21.91% to 28.44% of DD irrelevant leads. For partnerships the range was 22.63% to 27.00%.
The very quick argument is that ADDOLAR is a more accurate measure than DDOLAR for calculating performance. This is true. However, another factor is the difficulty of the leads that each player faces. Arguably this is a more important factor.
Ultimately we are attempting to compare leads between different players. There will, obviously, be differences in the difficulty of leads. We are relying on the Law of Large Numbers (LLN). It is important to understand this when doing comparisons of data.
If I look at the data of pairs/players that ACBL has convicted for cheating, the data of players that some National Bridge Organizations (NBOs) have convicted of cheating, and the data of those that have confessed to cheating, the difference in DDOLAR is approximately 3-6%. This may seem incredibly small, but this is the difference between a cheating player and a non-cheating player.
What is the ADDOLAR for these partnerships?
Same group of players. Here is the player data:
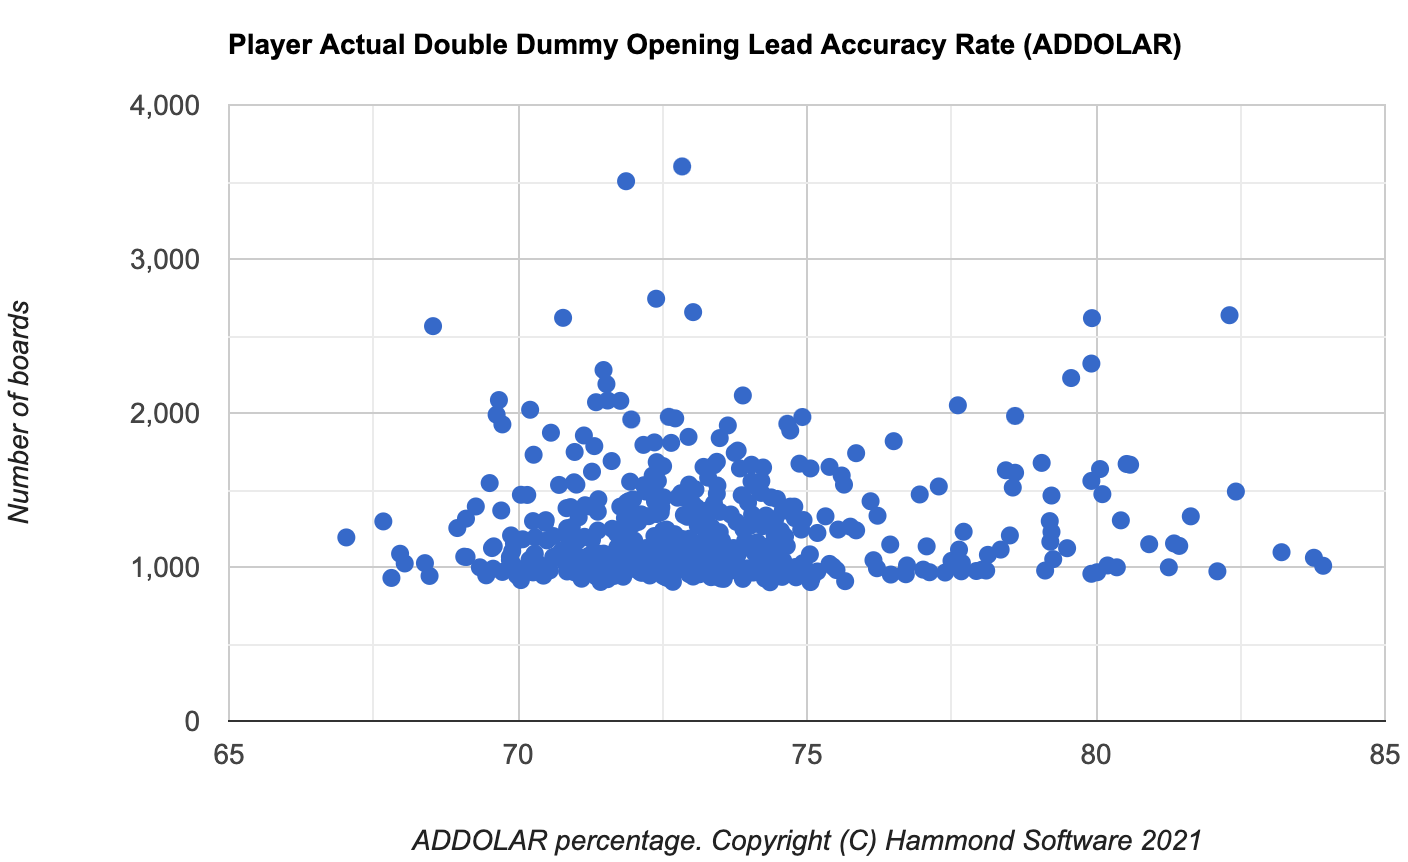
There are two players to the left of the chart with a SD of over 2. There are 32 players to the right of the chart with a SD of over 2. There are 7 players (included in the 32) to the right of the chart with a SD of over 3. It is reasonable to assume that there is cheating. This is not to say that all 32 players are cheating, I have additional checks that detect cheating on the opening lead.
ACBL have convicted a player for cheating that is ranked 30th or lower for ADDOLAR on this chart.
Here is the same data, but for partnerships:
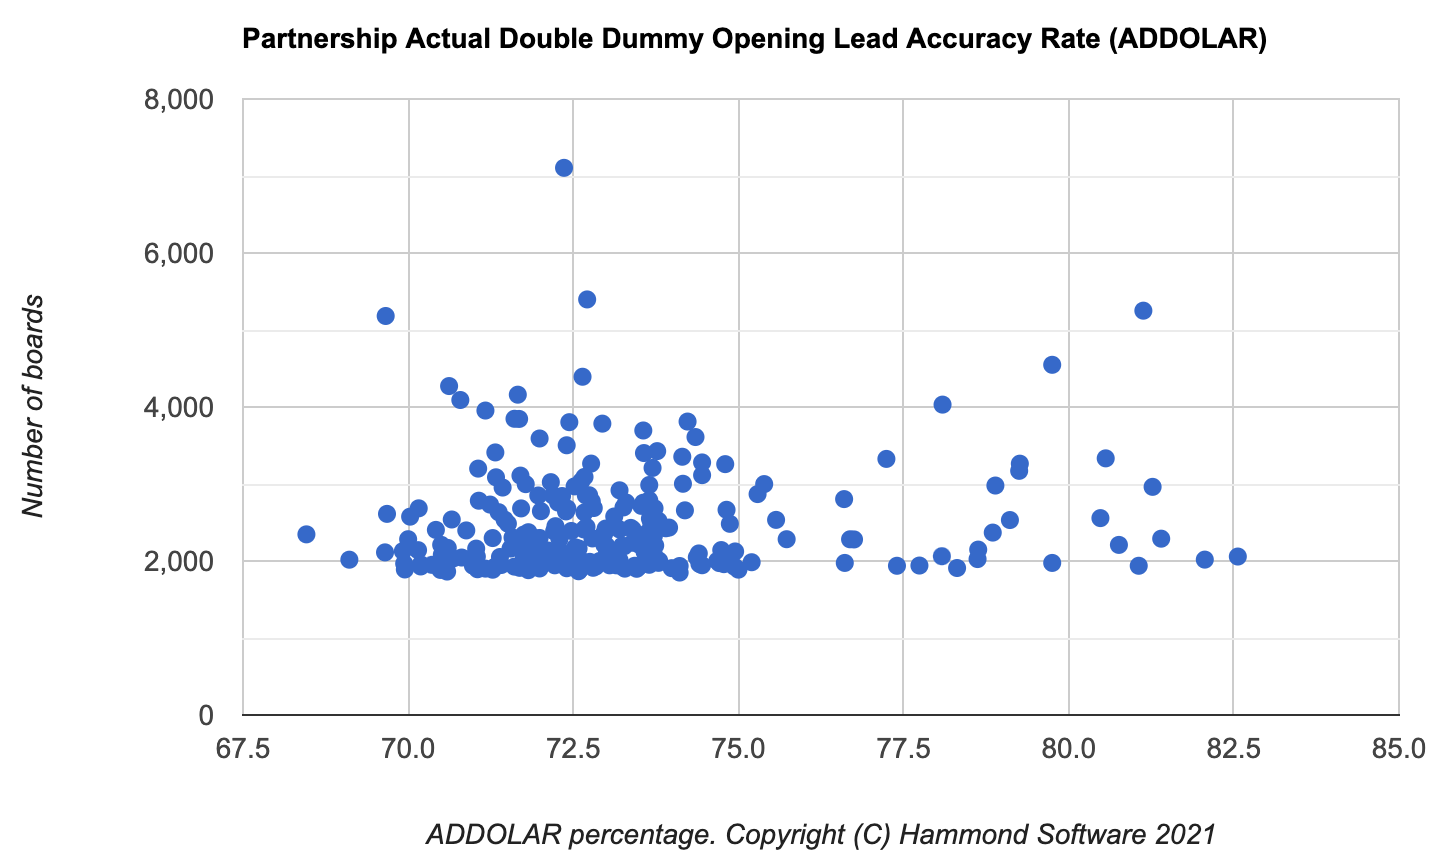
Again, we see a classic double hump cheating chart.
Let me write the above analogy in a form for the mathematicians/statisticians to understand.
Summary:
I hope that I have shown that Bridge statistics are performance metrics. They are not a coin flip. They are not a dice roll.
To reiterate the analogy above. Imagine 100 questions as described above, (corresponding to 100 leads). The questions are then shuffled. You have no idea the order of the questions. The Law of Large Numbers predicts that you should - with enough boards - have an approximately equally number of easy leads and an have an approximately equally number of difficults leads as other players. Once you get to the expert average, it is much harder to get the questions correct, the normal distribution no longer works.
What calculations should we use?
This is very difficult. You can certainly use the normal distribution as an approximation, but the further from the mean, the more wrong the normal distribution calculations will be. The better the player, the more wrong normal distribution calculations will be.