This 220-page book describes how it is possible to detect cheating in Bridge using statistical methods and mathematical models. It includes 119 figures of charts and tables showing how cheating pairs are detected. The book has comparisons of data of cheating pairs and non-cheating pairs. Detecting cheating in Bridge was an unsolved problem for over ninety years until now.
The book analyzes data from American Contract Bridge League (ACBL), European Bridge Leagure (EBL) and World Bridge Federation (WBF) events and shows that there are still active cheating pairs at the top level.
The charts depict the level of cheating in tournaments through 2015 and the sudden change in the amount of cheating after the summer of 2015 when some top level pairs were caught. The data shows there are more cheating pairs before 2015 that have not been caught.
The book shows the number of active pairs that are cheating in ACBL events.
Statistical analysis is done on World Championships from 1955, including the famous Italian Blue Team era. This data is compared to the known cheating pairs of today with some interesting results.
Opening lead styles from top pairs and events are analyzed leading to tips on improving your own game.
This is the first detailed statistical analysis of high level Bridge. It involves over 11,000,000 boards from ACBL, 240,000 boards from EBL, 360,000 boards from WBF, and 270,000 boards from Vugraph from over 290 tournaments.
I have had to wait four years, since the cheating scandals of 2015, to ensure there was enough post-2015 data to further validate the algorithms and statistics described in the books. A patent has been filed on the technology.
There are chapters on the five more recent cheating pairs: Buratti/Lanzarotti, Elinescu/Wladow, Fantoni/Nunes, Fisher/Schwartz and Piekarek/Smirnov. The chapters show how the various advanced cheating detection functions (ACDFs) described in the book can catch these known cheating pairs, without knowing their methods, and without any expert having to review hands. Similar tests can be done on suspected pairs.
Chapter 1 - Introduction
It is possible to detect collusive cheating in Bridge using statistical methods. This had been an unsolved problem in Bridge for over 90 years. It was solved about four years ago in 2015. More importantly, it does not require humans with expert Bridge logic to analyze individual hands to determine if a pair is cheating. Computers with sophisticated software do the work.
To be more precise, it is possible to detect pairs that collusively cheat, without knowing their cheating methods, within statistically acceptable limits. Given sufficient data, these same methods can be used to detect historical cheating.
Using similar methods, it can be statistically determined how good a player and/or partnership is. Similarly, it is possible to use the same techniques to determine weaknesses in an individual player or partnership for training purposes.
Detecting cheating in Bridge has been a problem since Harold Vanderbilt introduced the current rules in 1925. Several pairs have been caught, but proving cheating has required knowledge of their cheating code or methods. Since 2015 several top pairs have been caught cheating by deducing some of their code through videos. Future cheaters will use varying codes (different meaning on different board numbers) making it highly unlikely that any future cheaters will be caught using videos. Statistics becomes the only method to detect cheating. This book shows the many different statistical methods that can be used, and also how these methods are able to detect the known cheating pairs from the past, without knowing how they were cheating.
The book contains over 115 figures. This is one example:
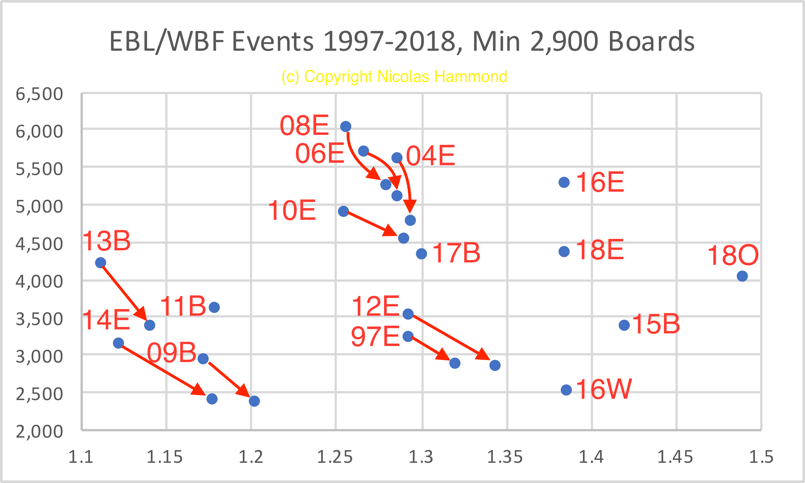
The data is from EBL/WBF events from 1997-2018 with a minimum of 2,900 boards on Vugraph. The code is a two digit year with B=Bermuda Bowl, E=European Bridge Team Championship, O=WBF Open Teams, W=EBL Winter Games. The Y axis is the number of boards from Vugraph for selected tournaments. The X axis is the MF value. The arrows shows what happens when data from the known cheating pairs is removed. In all cases, the value increases, as expected.
For the Bermuda Bowl, we see that 2009, 2011 and 2013 are all to the left of the chart. We assume that no one was willing to risk cheating in the 2015 Bermuda Bowl because of the cheating revelations in the summer of 2015. The 2015 MF value is way off to the right of the chart. This is what happens when all players are on notice that cheaters may be caught. This is the value from an honest Bridge tournament. For the 2017 Bermuda Bowl, the value has moved back to the center.
The 18O value is from the 2018 WBF Open Teams event in Orlando.
For the European events, we see that 2006-2014 are all to the middle or left of the chart. The MF value starts out below 1.30. The 2014 EBTC shows the most cheating. The 2016 EBTC and 2018 EBTC are significantly to the right. The EBL events are all over 1.38 since 2015.
Look at the tournaments on the right side of the chart, to the right of the 1.3 line. These are the recent tournaments, 2015-2018. Look at the tournaments on the left side of the screen, to the left of the 1.3 line. These are the pre-2015 tournaments. This dramatic change in the MF value cannot be explained by removing only the known cheating pairs. There was a dramatic change in the amount of cheating in top level Bridge after 2015. This last chart is the most damning evidence of this fact. The MF value was designed to detect cheating.
The chart illustrates the impact of cheating at the top levels of Bridge over the last twenty years. The chart shows the effect of removing the known cheating pairs. The MF value moves to the right when cheating pairs are removed. The chart shows the impact on the undetected cheating players when there is suspicion that they may be caught. The values for 2015-2018 are significantly to the right of previous years. Even when we remove the known cheating pairs from earlier data, the values for 2015-2018 are still significantly to the right. This indicates that there are many cheating pairs from earlier years that have not yet been caught. Examining the data shows who they are.

|
|